Getting started
Andreas M. Brandmaier
2023-02-17
Source:vignettes/Getting_started.Rmd
Getting_started.Rmd
library(pdc)Simulate data
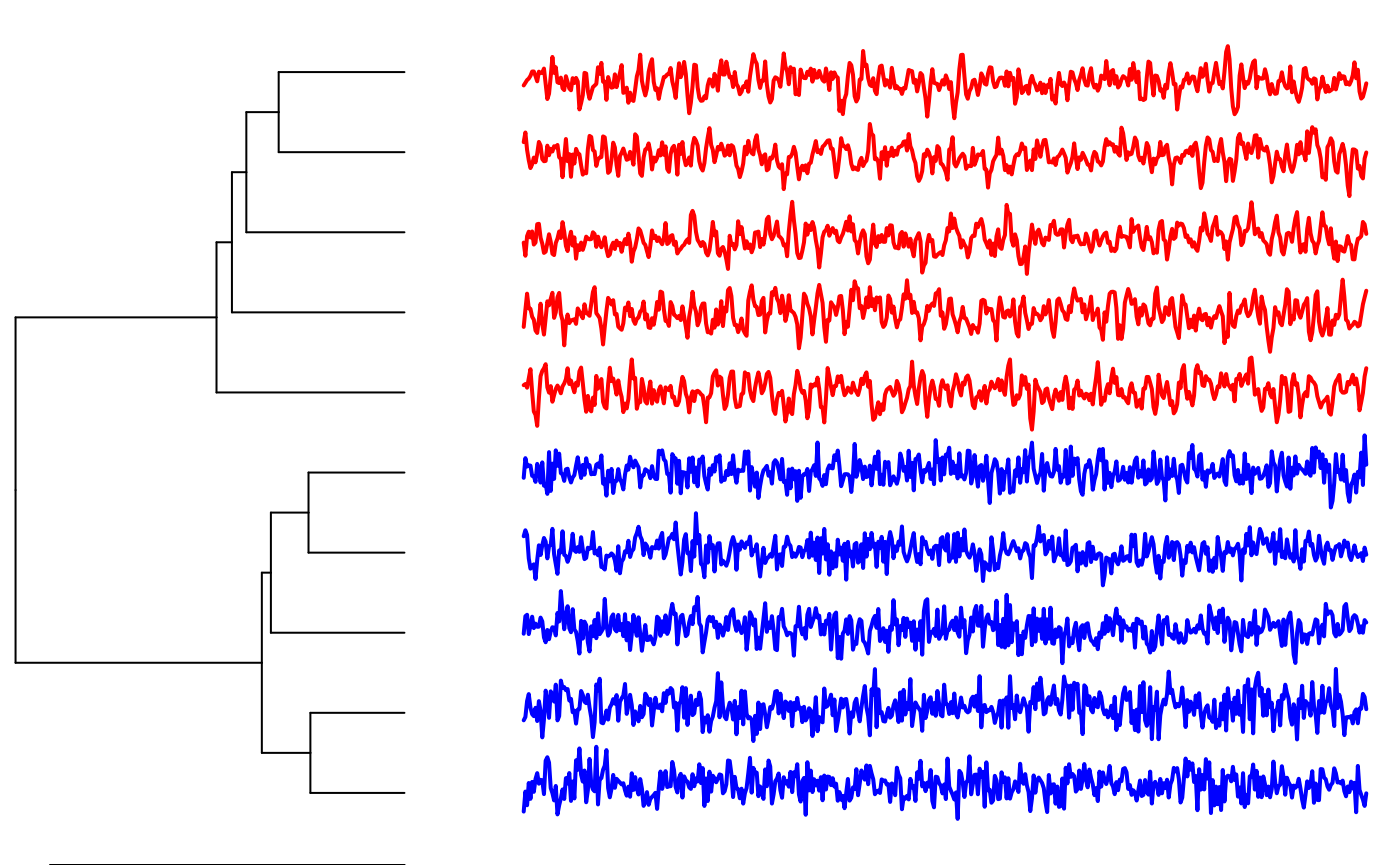
# generate 5 ARMA time series for the first group
grp1 <- replicate(5, arima.sim(n = 500, list(ar = c(0.8897, -0.4858),
        ma = c(-0.2279, 0.2488)),
            sd = sqrt(0.1796)) )

# generate 5 ARMA time series for the second group
grp2 <- replicate(5, arima.sim(n = 500, list(ar = c(-0.71, 0.18),
        ma = c(0.92, 0.14)),
            sd = sqrt(0.291)) )

# combine groups into a single dataset
X <- cbind(grp1,grp2)