Minimum Entropy Heuristic (MinE)
entropy.heuristic.RdThe information content of a permutation distribution depends crucially on the choice of the embedding dimension. Too small embedding dimensions narrow the representational power of the distribution, too large embedding dimensions dilute the estimation of the distribution. The Minimum Entropy Heuristic (MinE) automatically chooses an embedding dimension with an optimal representational entropy as proxy for representational power.
entropyHeuristic(X, m.min=3, m.max=7, t.min = 1, t.max = 1, normalize_by_observed = TRUE)
# S3 method for mine
print(x, ...)
# S3 method for mine
summary(object, ...)
# S3 method for mine
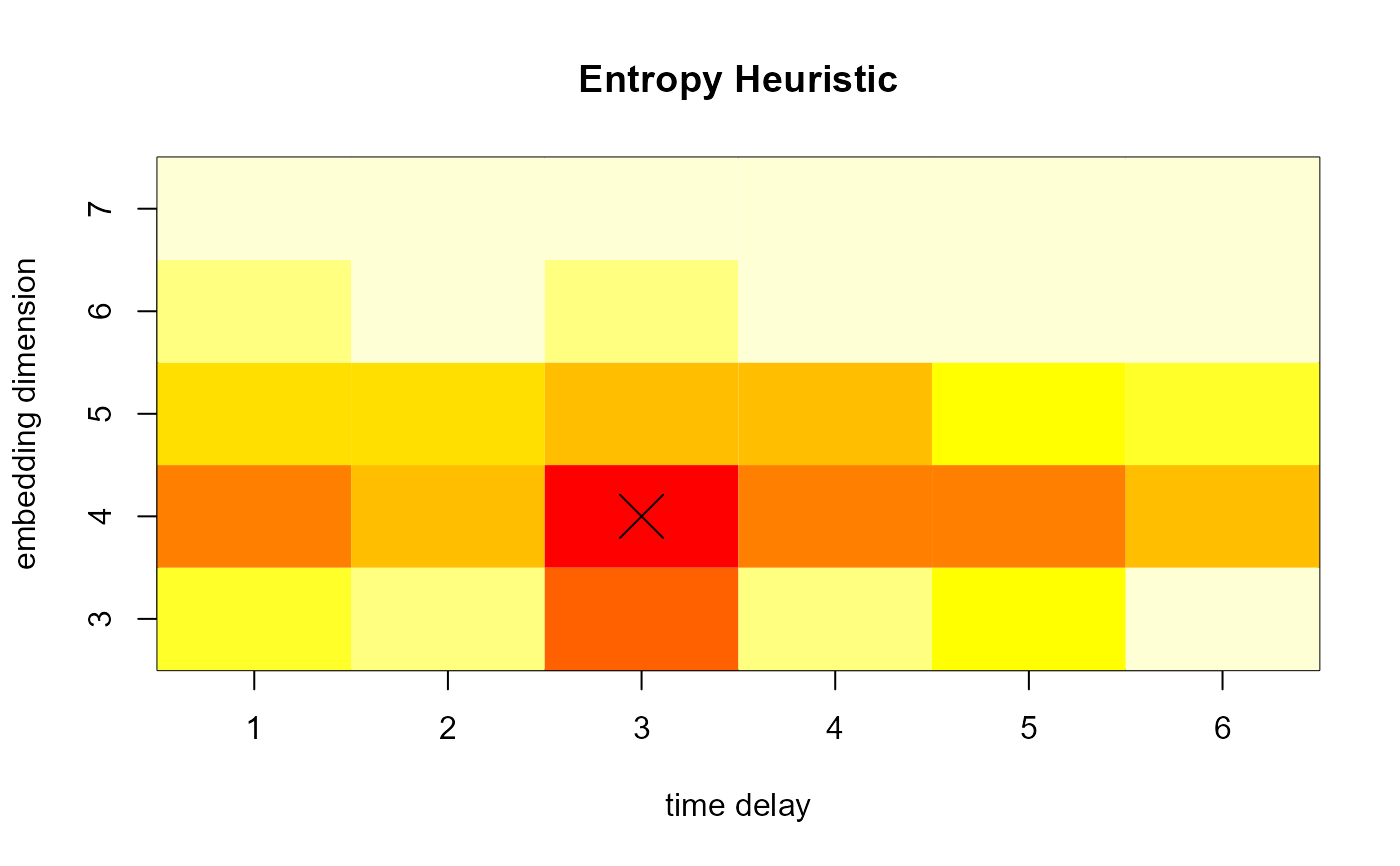
plot(x, normalize = FALSE, type = "image", mark.optimum = TRUE,
col = heat.colors(12), ...)Arguments
- X
A matrix representing a set of time series. Columns are time series and rows represent time points.
- x
An entropy heuristic object of type
mine.- object
An entropy heuristic object of type
mine.- m.min
Minimum embedding dimension
- m.max
Maximum embedding dimension
- t.min
Minimum time-delay
- t.max
Maximum time-delay
- normalize_by_observed
Boolean. If false, entropy is normalized by dividing by the logarithm of the number of all possible patterns. If true, it is divided by the logarithm of the number of observed patterns.
- ...
Further arguments for the generic print, summary, and plot method.
- normalize
Normalize values to range [0;1].
- type
Either 'image' or 'contour'. Specifies the plot type.
- mark.optimum
Mark the optimal embedding dimension and/or time-delay.
- col
A color map to represent entropy values on.
Details
For a range of embedding dimensions, the average entropy of the dataset is calculated. The embedding dimension with
the lowest entropy is chosen. print and plot is available for result objects.
The plot of a heuristic object shows the entropy values depending on a range of embedding dimensions and time-delays. If only embedding dimension or only time-delay is varied, a line plot is show to indicate the parameter yielding minimum entropy. Otherwise, an image plot is shown that indicates minimum entropy depending on both parameters.
Value
A list is returned with the following elements:
- m
The chosen embedding size.
- entropy.values
A vector with average entropy values corresponding to each entry in
entropy.ms- entropy.ms
A vector of the embedding dimensions that were searched for the optimal embedding.
References
Brandmaier, A. M. (2015). pdc: An R Package for Complexity-Based Clustering of Time Series. Journal of Statistical Software, 67(5), 1--23.
Brandmaier, A. M. (2012). Permutation Distribution Clustering and Structural Equation Model Trees. Doctoral dissertation. Saarland University, Saarbruecken, Germany.
See also
Examples
# (1)
#
# create a sine-wave with added noise
# and display a plot showing the average permutation entropy
# depending on varying choices of the embedding size
# (by default time-delay is not searched over)

heuristic <-  entropyHeuristic( sin(1:100)+rnorm(100,0,1) )
plot(heuristic)


# (2)
#
# calculate both optimal embedding dimension and time-delay
#
heuristic <-  entropyHeuristic( sin(1:100)+rnorm(100,0,1), t.min=1, t.max=6 )
plot(heuristic)
# (2)
#
# calculate both optimal embedding dimension and time-delay
#
heuristic <- entropyHeuristic( sin(1:100)+rnorm(100,0,1), t.min=1, t.max=6 )
plot(heuristic)