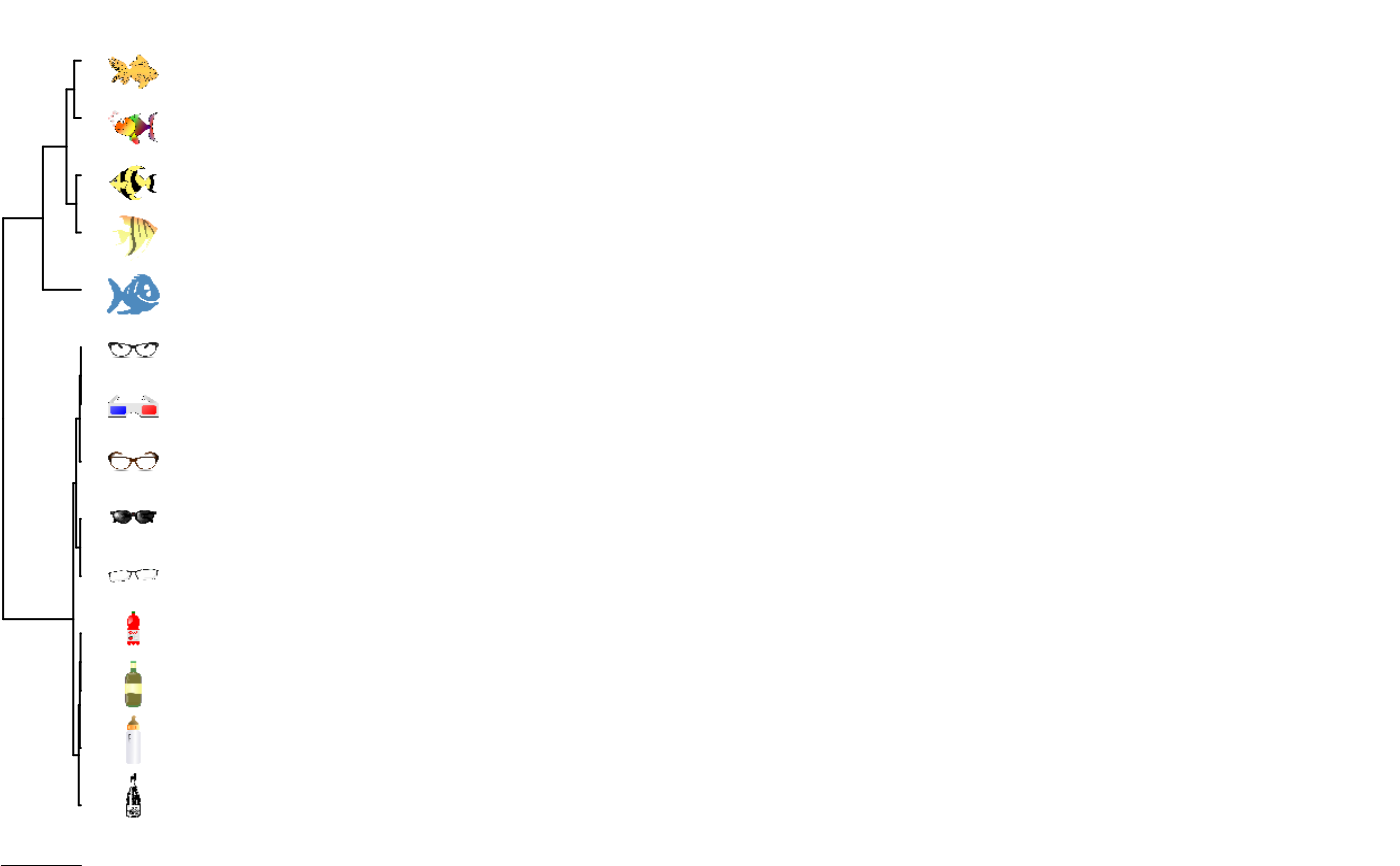
Dendrogram Plot with Images
rasterPlot.RdPlots a horizontal dendrogram with images as leafs
rasterPlot(cl, raw, monochrome=FALSE, aspect, ...)Arguments
- cl
A
pdclustobject.- raw
List of RGB images in matrix format.
- monochrome
Convert image to b/w representation.
- aspect
Aspect ratio.
- ...
Further graphical arguments.
References
Brandmaier, A. M. (2015). pdc: An R Package for Complexity-Based Clustering of Time Series. Journal of Statistical Software, 67(5), 1--23.