Shape Tracing of an Image
trace.image.RdTrace the shape of an image to create a shape signature
traceImage(img, resolution)

convertImage(imgrgb, threshold = 0.5)
Arguments
- img
a matrix of size width x height representing a black/white image with 0=white and 1=black.
- resolution
The angular resolution of the trace, i.e., the length of the resulting shape signature.
- imgrgb
a matrix of size width x height x channels representing an RGB image.
- threshold
The average intensity value that serves as boundary to separate black and white pixels.
Details
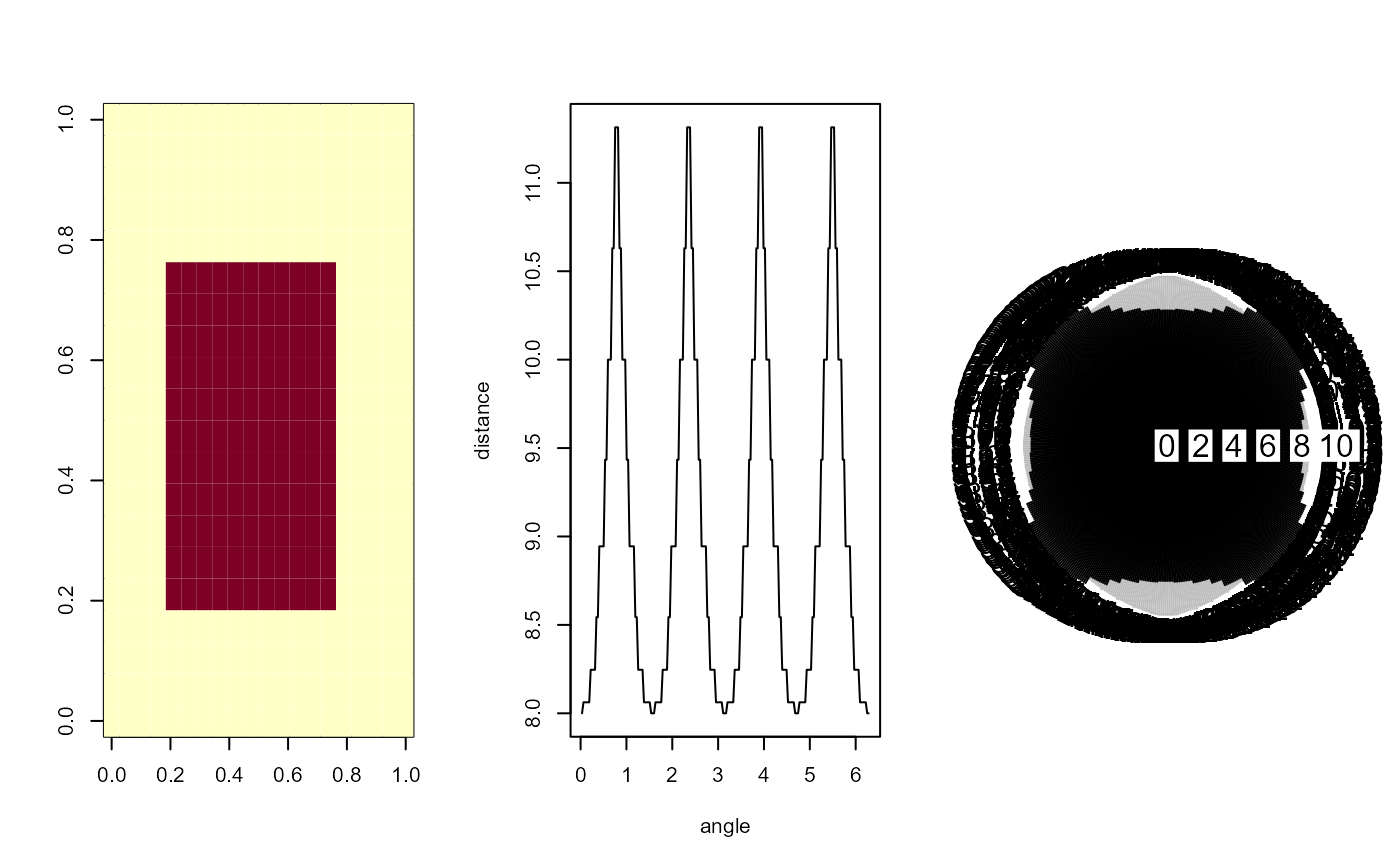
Shape signatures of objects can be created by unrolling their contour around its centroid across time. The resulting time series represents distance-to-center of points on the contour versus radial angle.
In order to create signatures for RGB images, convert the image with convert.image to a black-and-white image using a threshold between 0 and 1.
Exemplary datasets containing shape signatures for shape clustering are provided in this package as star.shapes and complex.shapes.
Value
Returns a list containing angles and corresponding distances from center.
References
Brandmaier, A. M. (2015). pdc: An R Package for Complexity-Based Clustering of Time Series. Journal of Statistical Software, 67(5), 1--23.
See also
Examples
# create a filled rectangle in a 20x20 image
img <- matrix(0, nrow=20,ncol=20)
img[5:15,5:15] <- 1

# create shape signature
signature <- traceImage(img)

# plot both original image and shape signature
par(mfrow=c(1,3))
#layout(matrix(c(1,2,2), 1, 3, byrow = TRUE))
image(img)
plot(signature$angle, signature$distance,type="l",xlab="angle",ylab="distance")

# reconstruct radial plot
# \donttest{
require("plotrix")
#> Loading required package: plotrix
radial.plot(traceImage(img,resolution=500)$distance,start=0,rp.type="r",radial.lim=c(0,10))

# }
# }